
Okay, my last post wasn’t really rocket science but did you ever heard about the James Martin Center for Nonproliferation Studies North Korea Missile Test Database? This is the “first database to record flight tests of all missiles launched by North Korea capable of delivering a payload of at least 500 kilograms (1102.31 pounds) a distance of at least 300 kilometers (186.4 miles).”
Unfortunately, it has become quite clear that the North Korea’s missile program has accelerated and made substantial progress over the past couple of years. And as usual, plotting things really helps to make one’s mind up. By documenting all such tests since the first one occurred in April 1984, this kind of dataset helps us to take the measure of North Korea’s missile program recent acceleration.
One last detail, as North Korea never stops to experiment, the database is being routinely updated.
How to recover the most current data
Many people still save their data into Microsoft Excel files. This is an unhappy choice for many reasons but a lot were already written about this topic. Unfortunately, this is what we have to deal with here. So choices to read the file are somehow limited. I personally like to use the readxl package.
I told you the database is being regularly updated. If we want to get the latest version of the file we need to use the curl package to download it directly from the website.
# Some settings
temp <- tempfile()
url <- "https://www.nti.org/documents/2137/north_korea_missile_test_database.xlsx"

# Then download it
curl_download(url, temp)

# And read it
nkMissile <- read_excel(temp, sheet = 1)
We get the following information about the tests.
colnames(nkMissile)
##  [1] "F1"                      "Date"
##  [3] "Date Entered/Updated"    "Launch Time (UTC)"
##  [5] "Missile Name"            "Missile Type"
##  [7] "Launch Agency/Authority" "Facility Name"
##  [9] "Facility Location"       "Other Name"
## [11] "Facility Latitude"       "Facility Longitude"
## [13] "Landing Location"        "Apogee"
## [15] "Distance Travelled"      "Confirmation Status"
## [17] "Test Outcome"            "Additional Information"
## [19] "Source(s)"
The F1 is the test identification number, then comes the test date, the missile type, the facility where it was fired from, flight information like apogee and distance, and some additional information which consists of a short written summary of the test.
Is the frequency of tests increasing over time?
Quite a hot topic, right? Let’s add a Year tag.
nkMissile$Year <- year(nkMissile$Date)Also interesting would be to know who was in charge at the time of the test. It requires us to add a Leader tag and for that we’ll need to create intervals with lubridate. Date where found on wikipedia, as usual.
KimIlsung <- ymd("1972-12-28") %--% ymd("1994-07-08")
KimJongil <- ymd("1994-07-08") %--% ymd("2011-12-17")
KimJongun <- ymd("2011-12-17") %--% today()
Let’s match it to the test date.
nkMissile$Leader <- ifelse(nkMissile$Date %within% KimIlsung == TRUE, "Kim Il-sung",
                           ifelse(nkMissile$Date %within% KimJongil == TRUE, "Kim Jong-il",
                           ifelse(nkMissile$Date %within% KimJongun == TRUE, "Kim Jong-un", NA)))
And here we go.
nkMissile %>%
  ddply(.(Leader, Year), summarise,
        total = length(F1)) %>%
  ggplot(aes(x = Year, y = total, fill = Leader)) +
  geom_bar(stat = "identity", alpha = .7, position = position_dodge()) +
  theme_minimal() +
  scale_fill_brewer(palette = "Set1") +
  labs(x = NULL, y = "Number of missiles tested",
       title = "North Korea's missile program over time",
       subtitle = "A family story") +
  theme(legend.title = element_blank())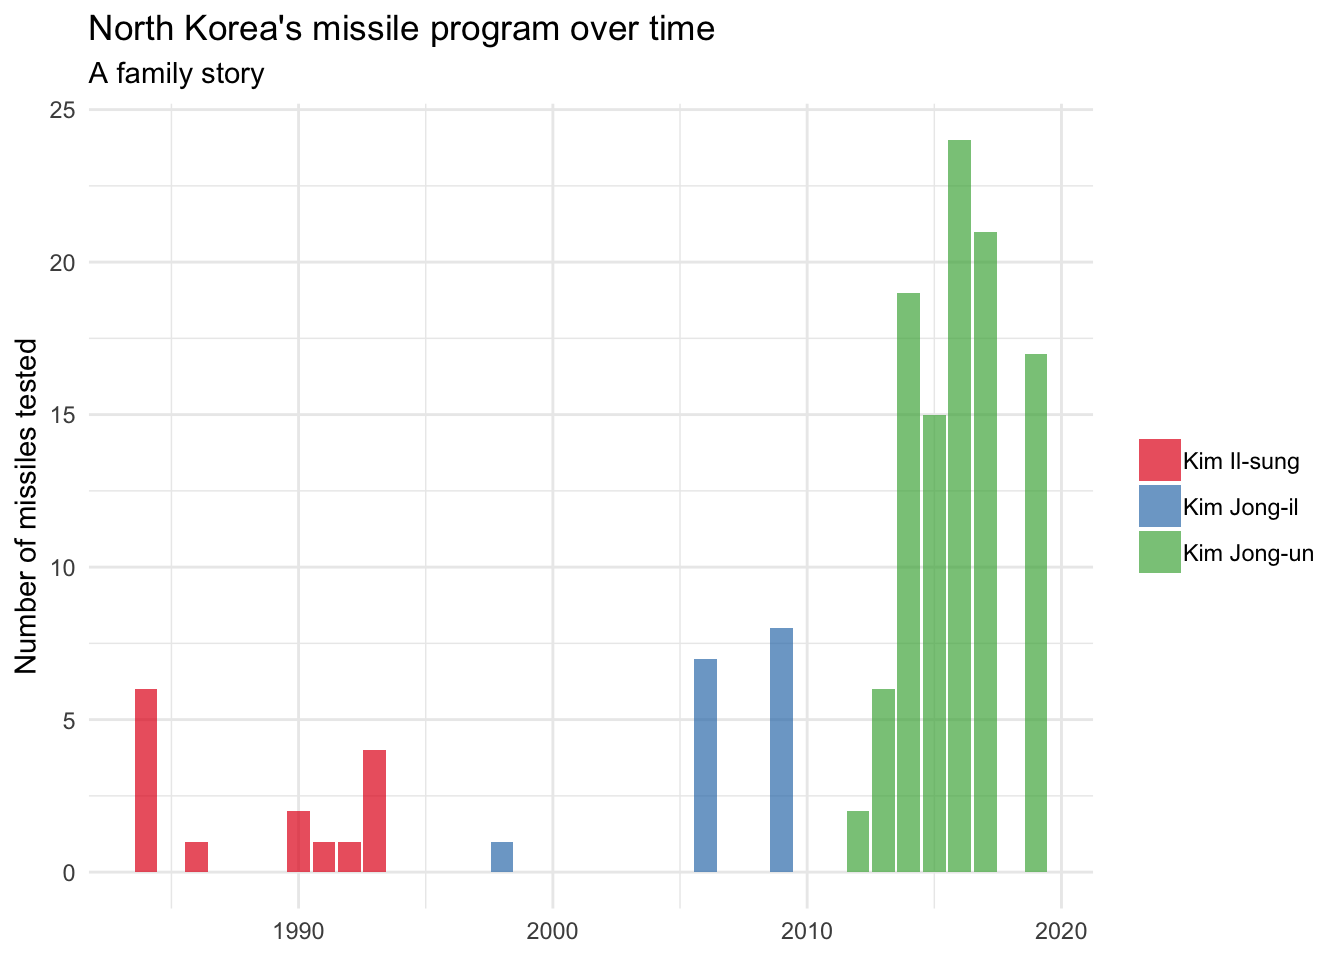
We can easily get the total number of tests per leader if we reorganize.
nkMissile %>%
  ddply(.(Leader), summarise,
        Missile = length(F1))
##        Leader Missile
## 1 Kim Il-sung      15
## 2 Kim Jong-il      16
## 3 Kim Jong-un     104
I think we have a clear winner! Kim Jong-un scores a truly impressive 104 missiles tested. And this truly rocket lover made it in half the time his predecessors reigned. That is what I’d call program acceleration. But what about potential progress over the past couple of years?
Did you say rocket science?
Let’s now have a look at the missiles themselves. How many different models do they have. Easy one.
unique(nkMissile$`Missile Name`)
##  [1] "Scud-B"      "Unknown"     "Nodong"      "Scud-C"      "Taepodong-1"
##  [6] "Unha"        "Unha-3"      "KN-02"       "Polaris-1"   "Musudan"
## [11] "ER Scud"     "Polaris-2"   "Hwasong-12"  "Scud-C MaRV" "Hwasong-14"
## [16] "Scud-B MaRV" "Hwasong-15"  "KN-23"       "KN-24"       "KN-25"
Mmm, 17 unique names. This is something none of the brewer palette chart can handle. We need to create some more.
# Define the length
colourCount <- length(unique(nkMissile$`Missile Name`))

# And adapt the 'Set3' palette
getPalette <- colorRampPalette(brewer.pal(9, "Set3"))
This now allows us to visualize all the 16 missiles and the unknown type. So we can visualize which missile was tested by all three leaders.
nkMissile %>%
  ddply(.(Leader, `Missile Type`, `Missile Name`), summarise,
        total = length(F1)) %>%
  ggplot(aes(x = Leader, y = total, fill = `Missile Name`)) +
  geom_bar(stat = "identity", alpha = .7, position = position_dodge()) +
  theme_minimal() +
  scale_fill_manual(values = getPalette(colourCount)) +
  labs(x = NULL, y = NULL,
       title = "Missiles tested by North Korean leaders",
       subtitle = "(One is more creative!)") +
  theme(legend.title = element_blank())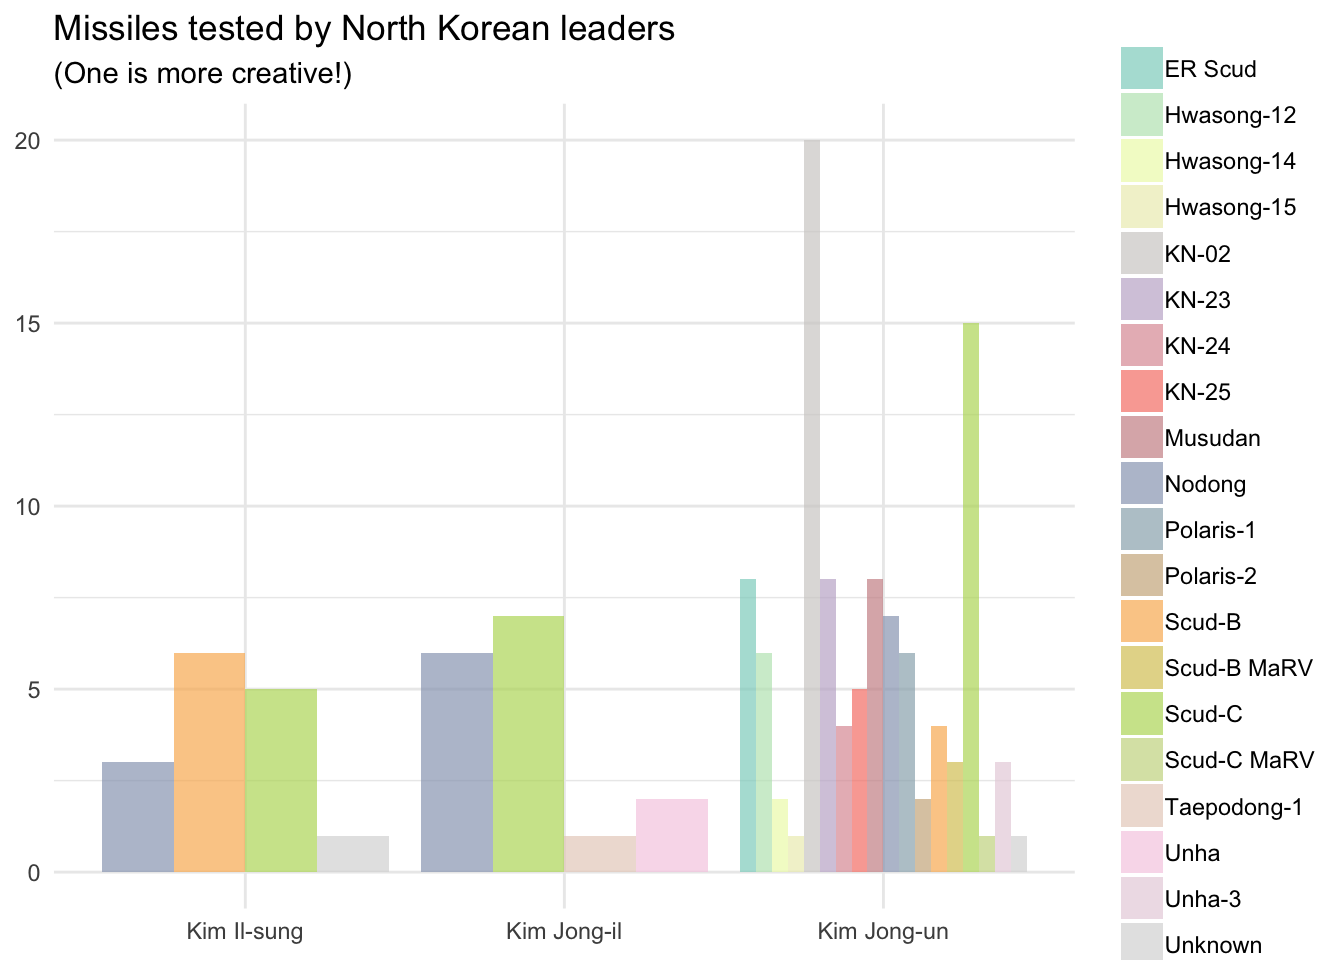
I must confess, probably like most of you, I never built a rocket myself and I do not really know a lot about missile science. I think we could try to organize them into types to get the big picture easily.
nkMissile %>%
  ddply(.(Leader, `Missile Type`, `Missile Name`), summarise,
        total = length(F1)) %>%
  ggplot(aes(x = `Missile Type`, y = total, fill = `Missile Name`)) +
  geom_bar(stat = "identity", alpha = .7, position = position_dodge()) +
  theme_minimal() +
  scale_fill_manual(values = getPalette(colourCount)) +
  labs(x = NULL, y = NULL,
       title = "Tested types of missile",
       subtitle = "And respective names") +
  theme(legend.title = element_blank(), axis.text.x = element_text(angle = 45)) +
  facet_wrap(~Leader, ncol = 3) +
  theme(strip.text.x = element_text(face="bold"),
        strip.background = element_blank())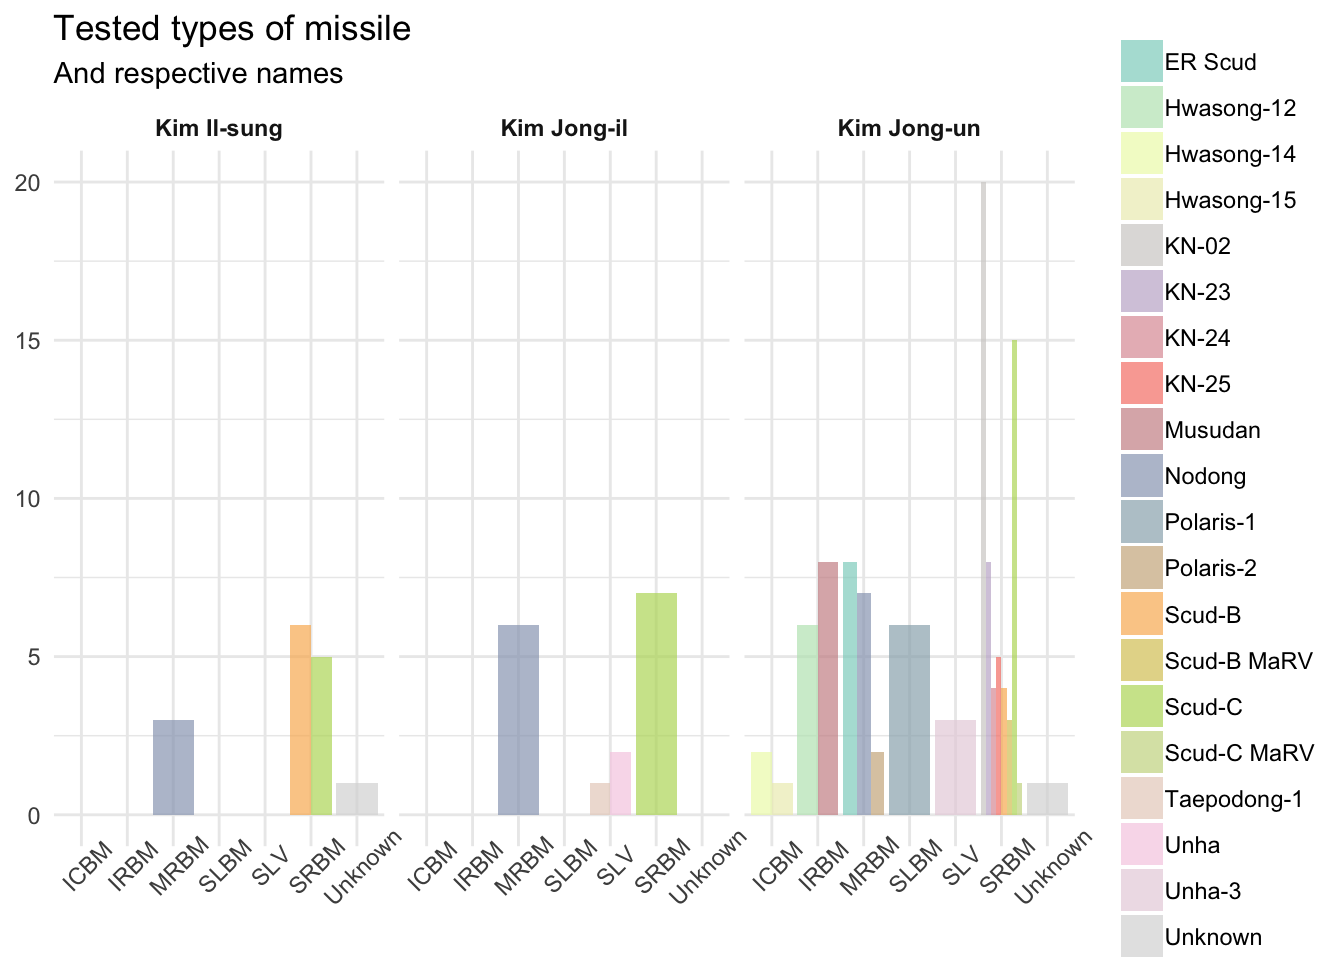
Well okay, one can reasonably assume that the unknown name would most certainly belong to one of those five types. It clearly appears that Kim Jong-un is far more creative and explores many more types of missiles than its predecessors. Whereas, Kim Il-sung and Kim Jong-il restricted themselves to ~2-3 types only, he is the only one testing all of them. He also seems to have a clear preference for the SRBM type. Is there maybe a reason for that?
How far can they travel?
I’m afraid I have some bad news for you now. Distance aren’t available for all of them. So we can only work on a subset here. In addition to that, we have to do some cleaning as they all contain ‘km’, and therefore must have been handled as factors. Lastly, we have to convert to numeric. As I told you the .xlsx file is an unhappy choice. So it looks weird, I know.
# Select missiles for which we have travel distance only
nkDistance <- subset(nkMissile, grepl("km", `Distance Travelled`))

# Get rid of the ' km' and ','
nkDistance$`Distance Travelled` <- gsub(" km", "", nkDistance$`Distance Travelled`)
nkDistance$`Distance Travelled` <- gsub(",", "", nkDistance$`Distance Travelled`)

# Convert to numeric
nkDistance$`Distance Travelled` <- as.numeric(as.character(nkDistance$`Distance Travelled`))
After this preliminary work we can use the distance and compare missile types.
nkDistance %>%
  ddply(.(`Missile Type`, `Missile Name`), summarise,
        dist = mean(`Distance Travelled`)) %>%
  ggplot(aes(x = `Missile Type`, y = dist, fill = `Missile Name`)) +
  geom_bar(stat = "identity", alpha = .7, position = position_dodge()) +
  theme_minimal() +
  scale_fill_manual(values = getPalette(colourCount)) +
  labs(x = NULL, y = NULL,
       title = "What is the distance they can travel",
       subtitle = "Based on the North Korean tests") +
  theme(legend.title = element_blank())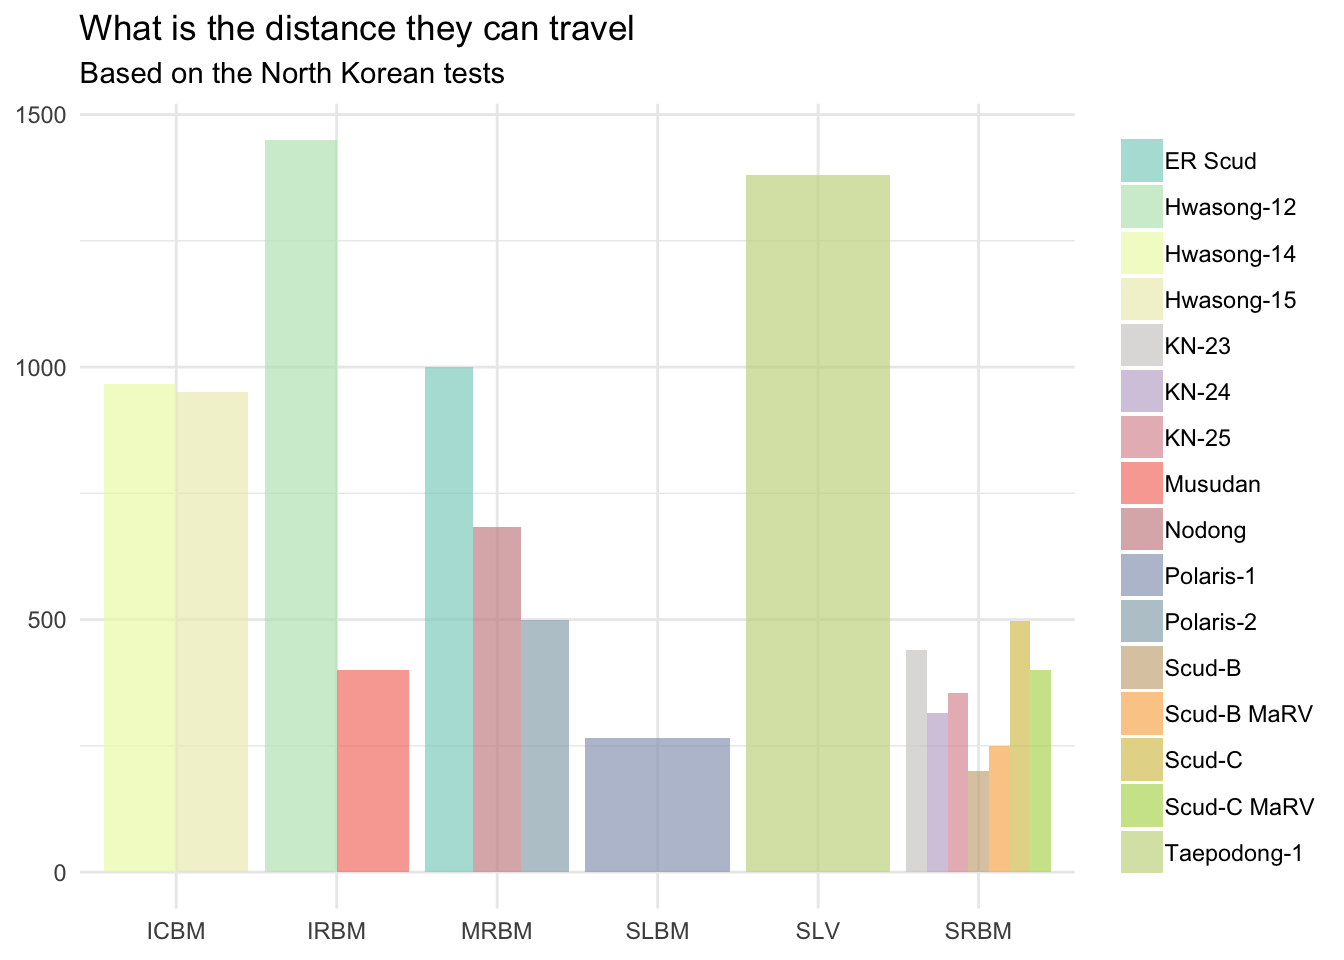
No surprise here, they all seem to travel short, intermediate, and medium distance as one could guess as per their name. Of course, if less tested, we rely on less data to estimate the mean, which therefore could not reflect the reality at all. Kim Jong-un favorite flavor of missile, the SRBM type, isn’t traveling long distance. Could this possibly be due the the numerous failures?
ddply(nkDistance, .(`Missile Type`, `Missile Name`), summarise,
      Max.Distance = max(`Distance Travelled`))
##    Missile Type Missile Name Max.Distance
## 1          ICBM   Hwasong-14          998
## 2          ICBM   Hwasong-15          950
## 3          IRBM   Hwasong-12         3700
## 4          IRBM      Musudan          400
## 5          MRBM      ER Scud         1000
## 6          MRBM       Nodong         1000
## 7          MRBM    Polaris-2          500
## 8          SLBM    Polaris-1          500
## 9           SLV  Taepodong-1         1380
## 10         SRBM        KN-23          690
## 11         SRBM        KN-24          400
## 12         SRBM        KN-25          380
## 13         SRBM       Scud-B          200
## 14         SRBM  Scud-B MaRV          250
## 15         SRBM       Scud-C          500
## 16         SRBM  Scud-C MaRV          400
No! On the contrary they all seem to work pretty well.
Okay, planning to visit the country anyway?
Not a good idea, I warn you! If you really have to, what are the places to avoid the most. All of them, yes I know… But if you really, really have to, or want to and even if I doubt someone wants to do tourism there.
If we want to find the places the missile tests are conducted we have to reorganize per Facility (and we will keep the Leader tag for the facet).
geoMissile <- ddply(nkMissile, .(Leader, `Facility Name`, `Facility Longitude`, `Facility Latitude`), summarise,
                    total = length(`Facility Location`))
We get a list of all the different sites used by the three leaders and their location.
geoMissile[, 2:4]
##                         Facility Name Facility Longitude
## 1                Chihari Missile Base 126.68470000000001
## 2  Tonghae Satellite Launching Ground         129.666664
## 3            Kittaeryong Missile Base           127.6236
## 4  Tonghae Satellite Launching Ground         129.666664
## 5                              Baegun 125.22732600000001
## 6                      Hodo Peninsula           127.5369
## 7                             Hungnam 127.66374999999999
## 8                             Hwangju         125.702005
## 9                    Kaechon Air Base         125.899905
## 10                            Kaesong           126.5878
## 11           Kittaeryong Missile Base           127.6236
## 12              Kusong Testing Ground 125.22302000000001
## 13                      Kwail Airbase         125.024421
## 14                       Lake Yonpung 125.80358510000001
## 15                         Masikryong         127.250257
## 16              Mupyong-ni Arms Plant         126.425743
## 17                              Nampo 125.32470000000001
## 18        North Kusong Testing Ground           125.2099
## 19                           Panghyon         125.269192
## 20                   Panghyon Airbase 125.20788899999999
## 21                  Pukchang Airfield         125.964333
## 22                    Pyongsong Field            125.869
## 23    Pyongyang International Airport 125.67325599999999
## 24                     Sinpo Shipyard 128.18389999999999
## 25  Sohae Satellite Launching Station 124.70569999999999
## 26                     Sondok Airbase 127.47320000000001
## 27                    Sunchon Airbase          125.89031
## 28                           Tongchan         127.891882
## 29                            Unknown            Unknown
## 30 Wonsan Kalma International Airport           127.4817
##     Facility Latitude
## 1  38.623330000000003
## 2  40.849996599999997
## 3  38.990830000000003
## 4  40.849996599999997
## 5  40.029677999999997
## 6  39.401670000000003
## 7  39.811610999999999
## 8  38.686833999999998
## 9  39.752321000000002
## 10 37.938200000000002
## 11 38.990830000000003
## 12 40.013249999999999
## 13 38.421522000000003
## 14 39.618282999999998
## 15 39.065961999999999
## 16 40.611207999999998
## 17 38.752299999999998
## 18 40.065899999999999
## 19 39.872152999999997
## 20 39.927472000000002
## 21 39.504416999999997
## 22 39.281999999999996
## 23 39.200158999999999
## 24 40.036799999999999
## 25 39.659599999999998
## 26 39.743699999999997
## 27 39.412593999999999
## 28 38.953797000000002
## 29            Unknown
## 30 39.167700000000004
One Unknown though. See the issue coming? Rather delete it right away.
geoMissile <- geoMissile[-which(geoMissile$`Facility Name` == "Unknown"),]But that’s not enough! See the other issue coming?
class(geoMissile$`Facility Longitude`)
## [1] "character"
Yes, you know the trick. Better do something right now.
geoMissile$`Facility Longitude` <- as.numeric(as.character(geoMissile$`Facility Longitude`))
geoMissile$`Facility Latitude` <- as.numeric(as.character(geoMissile$`Facility Latitude`))
Okay, at least we can plot now. Let’s do it per Leader to really judge the difference.
qmplot(data = geoMissile,
       x = `Facility Longitude`, y = `Facility Latitude`,
       size = total, maptype = "terrain", col = Leader, alpha = .25) +
  theme(legend.position = "none") +
  scale_fill_brewer(palette = "Set1") +
  facet_wrap(~Leader, ncol = 1) +
  theme(strip.text.x = element_text(face="bold"),
        strip.background = element_blank())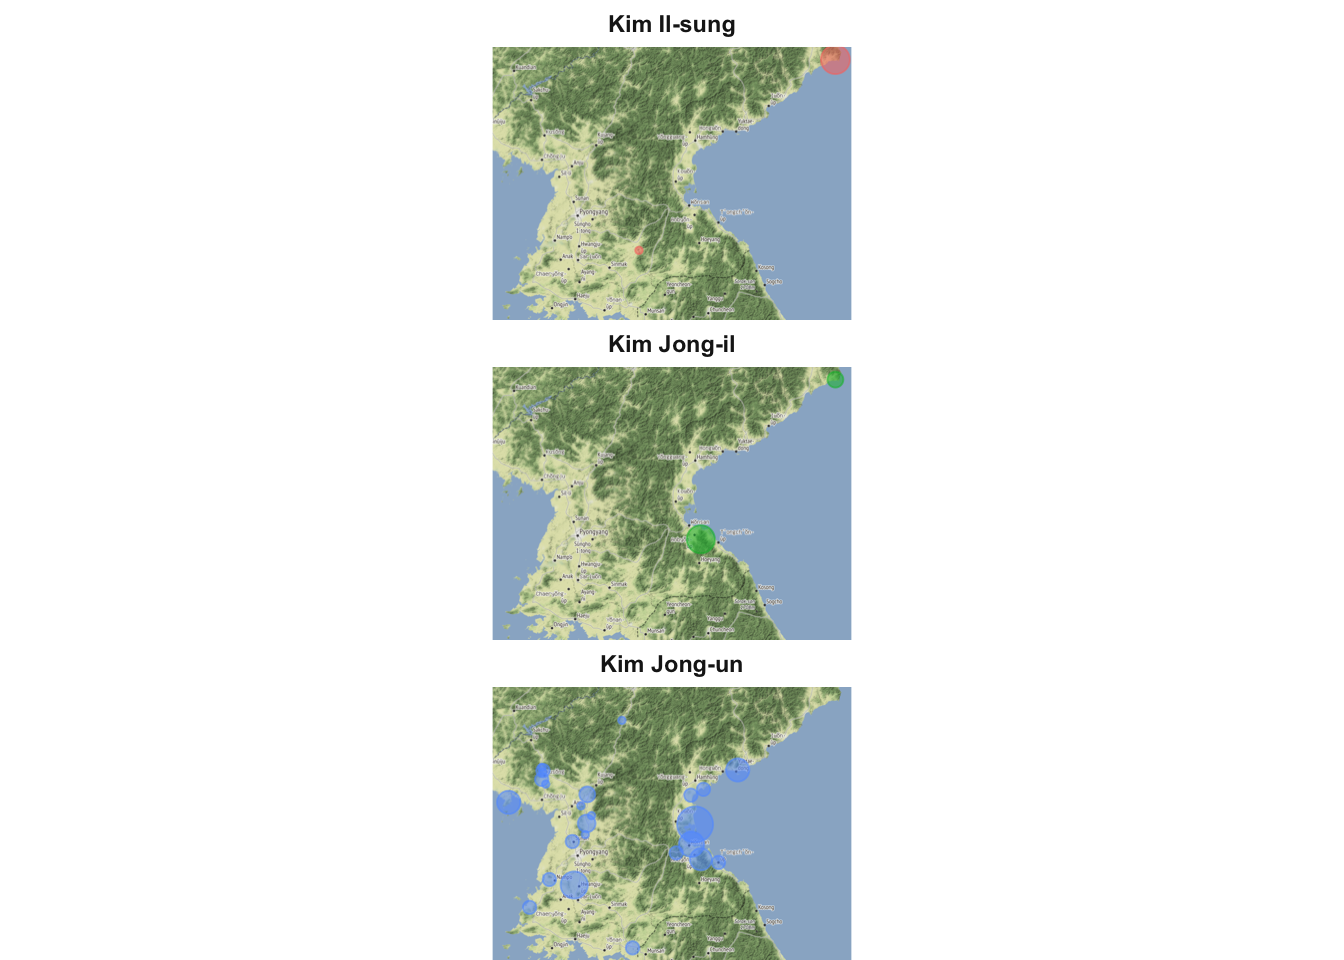
This time again, and even if Kim Jong-un does not seem to beat Kim Il-sung and Kim Jong-il in all categories, he is astonishingly perseverant. He is the only one testing all over the country!
Conclusion
Alright, at a first glance it looks pretty clear. Since Kim Jong-un took over the leadership, missile tests are booming all over the country. He was able to test almost three times more missiles than both previous leaders together. That’s clearly an acceleration.
Of course, I’ll have to check wikipedia now as something is bothering me. What is the difference among all missiles? MRBM and SRBM were used by the first leaders and are still the most tested by Kim Jong-un. Successfully fired some can already reach Japan.
Among Kim Jong-un new toys are some IRBM, SLBM, and SLV. Not really good news for the rest of us as these clearly could lead to greater range and speed missiles than the North Korean currently possess, like ICBM.