
A while ago, I had a lot of fun classifying all novels from Edgar Allan Poe. I’m a great admirer of his work and tried to go beyond polarity sentiment classification looking at emotional states such as “angry”, “sad”, and “happy” using the syuzhet package. I couldn’t help noticing there are some new R packages available like the tidytext one. I have been thinking about giving it a try for a long time now as it has been published by the excellent Julia Silge and David Robinson.
In my whole life, I have known no wise people (over a broad subject matter area) who didn’t read all the time — none. Zero. Charlie T. Munger
Beside, reading is a most pleasant activity. I personally can’t get enough of it and, while all books are written using 100% recycled words, I’m continuously amazed by the variety of feelings and emotions they set free. Naturally, I read a lot of novels too. Fantasy is an exercise bicycle for the mind. It might not take you anywhere, but it tones up the muscles that can. The gutenbergr package now helps me download and process public domain works from the Project Gutenberg to feed my collection.
Something is rotten in the state of Germany
On December 30, 2015, the Frankfurt am Main Regional Court ordered that access to certain items in the Project Gutenberg collection are blocked from Germany after a claim from the S. Fischer Verlag. Although Project Gutenberg believes the Court has no jurisdiction over the matter access to website and sub-pages to all of Germany is blocked until the issue is resolved.
That’s a real pain if you located in Germany but I won’t comment further. Fortunately enough, you can use the gutenberg_download function from the gutenbergr package to download your book anyway.
Let’s say you’re looking for the terrifying The King in Yellow from Robert W. Chambers. First we need to locate the work. Using the website itself isn’t an alternative from Germany. Otherwise, it’s up to you.
gutenberg_works(author == "Chambers, Robert W. (Robert William)") %>%
  filter(title == "The King in Yellow")
## Warning: `filter_()` is deprecated as of dplyr 0.7.0.
## Please use `filter()` instead.
## See vignette('programming') for more help
## This warning is displayed once every 8 hours.
## Call `lifecycle::last_warnings()` to see where this warning was generated.
## Warning: `distinct_()` is deprecated as of dplyr 0.7.0.
## Please use `distinct()` instead.
## See vignette('programming') for more help
## This warning is displayed once every 8 hours.
## Call `lifecycle::last_warnings()` to see where this warning was generated.
## # A tibble: 1 x 8
##   gutenberg_id title author gutenberg_autho… language gutenberg_books… rights
##          <int> <chr> <chr>             <int> <chr>    <chr>            <chr>
## 1         8492 The … Chamb…            38191 en       Horror           Publi…
## # … with 1 more variable: has_text <lgl>
Okay, let’s seize this classic book of short stories.
kingYellow <- gutenberg_download(8492)Streamgraphing feelings and emotions
The King in Yellow contains short stories and is named after a play with the same title which recurs as a motif through some of the stories.
The tidy text format is defined as being a table with one-token-per-row. Structuring text data in this way means that it conforms to tidy data principles and can be manipulated with a set of consistent tools. We can restructure the text easily using the unnest_tokens() function.
Let’s break down by sentences.
sentences <- kingYellow %>%
  unnest_tokens(sentence, text, token = "sentences")
The tidytext package contains several sentiment lexicons for evaluating the opinion or emotion in text. I prefer the nrc lexicon because this one categorizes words into 10 different categories: positive, negative, anger, anticipation, disgust, fear, joy, sadness, surprise, and trust.
We can map it to the sentences.
sentiment <- sentences$sentence %>%
  map_df(get_nrc_sentiment)
## Warning: `group_by_()` is deprecated as of dplyr 0.7.0.
## Please use `group_by()` instead.
## See vignette('programming') for more help
## This warning is displayed once every 8 hours.
## Call `lifecycle::last_warnings()` to see where this warning was generated.
## Warning: `data_frame()` is deprecated as of tibble 1.1.0.
## Please use `tibble()` instead.
## This warning is displayed once every 8 hours.
## Call `lifecycle::last_warnings()` to see where this warning was generated.
And aggregate sentences 100 by 100 to get an idea of the general sentiment throughout the book. We certainly can pipe this into a streamgraph. It represents the evolution of a numeric variable for several groups. Areas are usually displayed around a central axis, and edges are rounded to give a flowing shape, resulting in a flowing, organic shape
tidyYellow <- cbind(sentences, sentiment) %>%
  rename(line = gutenberg_id) %>%
  mutate(line = c(rep(1:46, each = 100), rep(47, 98)))
It is straightforward to build in R thanks to the excellent streamgraph package from Bob Rudis.
Let’s start with the general feeling only.
tidyYellow %>%
  select(line, positive, negative, -sentence) %>%
  group_by(line) %>%
  summarise_if(is.numeric, mean) %>%
  pivot_longer(-line) %>%
  streamgraph(key    = "name",
              value  = "value",
              date   = "line",
              height = "300px",
              width  = "750px",
              scale  = "continuous")
Or we can have a look at all these emotions.
tidyYellow %>%
  select(-positive, -negative, -sentence) %>%
  group_by(line) %>%
  summarise_if(is.numeric, mean) %>%
  pivot_longer(-line) %>%
  streamgraph(key    = "name",
              value  = "value",
              date   = "line",
              height = "300px",
              width  = "750px",
              scale  = "continuous")
Be the way it creates an htmlwidget so you can interact with the plots.
Streamgraphs are really awesome! I knew I wanted to use them the first time I’ve seen one. We can see the bumps introduced by certain stories. For example there is a variety of sentiment and a big fat bubble of anticipation in formation between 10 and 15. The second half of the book seems flat in comparison. That’s quite interesting as the first half of the book is known to feature highly esteemed weird stories with recurrent mention of The King in Yellow, a forbidden play which induces despair or madness in those who read it.
Breaking down by novels
Okay, let’s have a look at the different stories. I’m afraid there is no real chapter so we cannot simply regex and we need to have the name of all these individual stories.
This way we can keep track of the story number.
stories <- "THE REPAIRER OF REPUTATIONS|THE MASK|IN THE COURT OF THE DRAGON|THE YELLOW SIGN|THE DEMOISELLE D'YS|THE PROPHETS' PARADISE|THE STREET OF THE FOUR WINDS|THE STREET OF THE FIRST SHELL|THE STREET OF OUR LADY OF THE FIELDS|RUE BARREE"

sentences <- kingYellow %>%
  mutate(story = cumsum(str_detect(text, stories))) %>%
  unnest_tokens(sentence, text, token = "sentences")
I’ve noticed RUE BARREE appears a second time in the story, generating a false 11th story. Sometimes, I get lazy and advocate for the easy fix.
sentences$story <- ifelse(sentences$story == 11, 10, sentences$story)This should sound familiar. I’m just redoing the mapping as the dimensions slightly changed.
sentiment <- sentences$sentence %>%
  map_df(get_nrc_sentiment)
As well as the following line. Incidentally, we can get rid of story 0 that only contains the title page.
tidyYellow <- cbind(sentences, sentiment) %>%
  select(-gutenberg_id) %>%
  filter(story != 0)
And because it is always nicer to properly annotate our plots, let’s save the stories’ titles too.
titles <- c("The Repairer of\n Reputations", "The Mask", "In the Court of\n the Dragon",
            "The Yellow\n Sign", "The Demoiselle\n d'Ys", "The Prophets'\n Paradise",
            "The Street of the\n Four Winds", "The Street of the\n First Shell",
            "The Street of Our Lady\n of the Fields", "Rue Barrée")
Clustering sentiments in the stories
A bit of piping, some wrangling and we can heatmap these stories highlighting the mean sentimental values for each one of them.
tidyYellow  %>%
  select(-positive, -negative) %>%
  group_by(story) %>%
  summarise_if(is.numeric, mean) %>%
  pivot_longer(-story) %>%
  ggplot(aes(x = name, y = as.factor(story), fill = value)) +
  geom_tile(color = "white", size = .5) +
  scale_fill_viridis_c() +
  scale_y_discrete(label = titles) +
  theme_minimal() +
  coord_flip() +
  theme(legend.title = element_blank(),
        axis.title   = element_blank(),
        axis.text.x  = element_text(angle = 45, hjust = 1))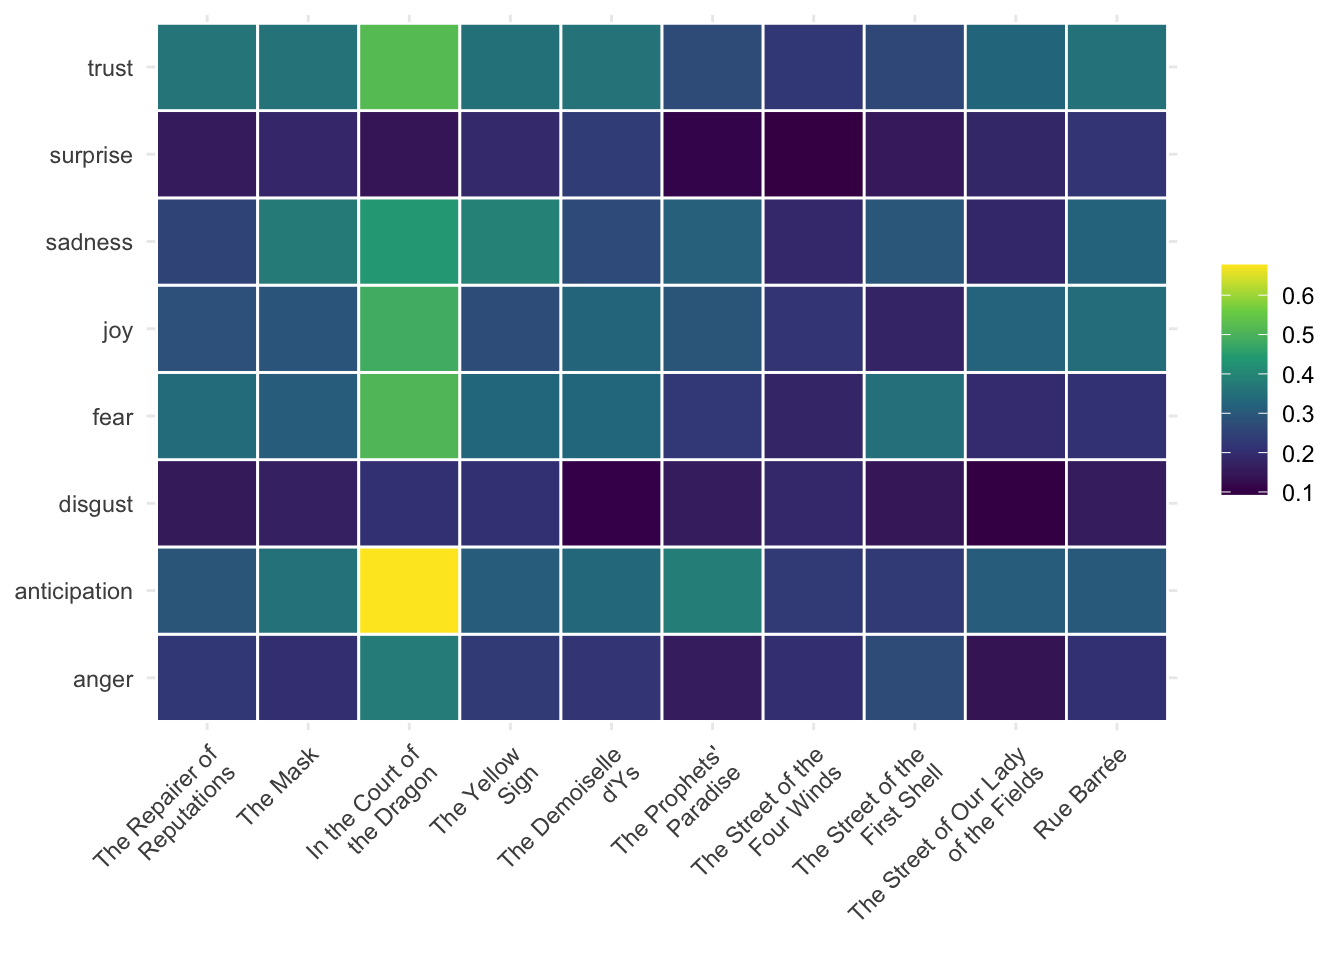
It clearly appears that the first part of the book contains the most emotional stories. Story number 3, In the Court of the Dragon, is clearly highlighted on this map. It has both the largest panel of sentiments and the highest mean values. If you’re looking for some sentimental exercise, this one is clearly a good candidate. This story is also one of the most mysterious in the collection.
A quick hierarchical clustering can help us to organize them looking at dissimilarities.
tidyYellow  %>%
  select(-positive, -negative) %>%
  group_by(story) %>%
  summarise_if(is.numeric, mean) %>%
  select(-story) %>%
  dist() %>%
  hclust() %>%
  plot(main   = "",
       xlab   = "",
       sub    = "")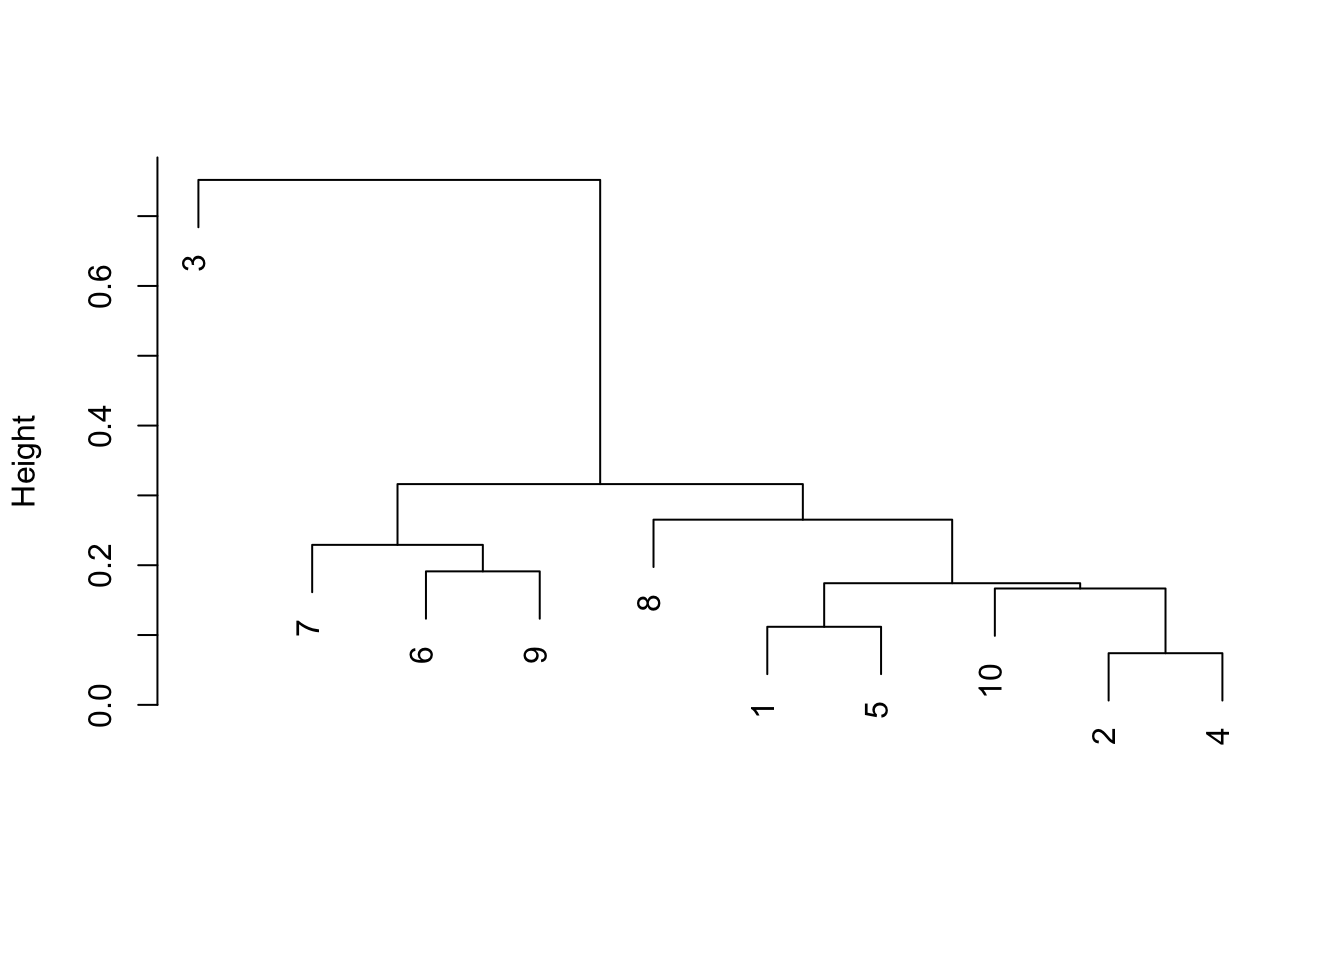
I like this a lot. In the Court of the Dragon (number 3) is obviously the most intense story. But we also quite clearly can see the different in between the first and the second half of the book. Stories number 1, 2, 4, and 5 definitively cluster apart from stories number 6, 7, 8, and 9. That’s awesome and also correspond to the most famous stories of the book. I wonder if this is some kind of explanation.
Streamgraph are really cool
Since we now have individual stories at hand and just because streamgraph look so amazing we can have a look and compare both the most intense one–In the Court of the Dragon–and The Street of the Four Winds that appears to be the less intense one in this corpus.
Simple filtering will do. Please note I’m also aggregating sentences 10 by 10 now to have a closer look at the sentiments developing along the story.
courtDragon <- tidyYellow  %>%
  filter(story == 3) %>%
  select(-positive, -negative) %>%
  mutate(line = c(rep(1:19, each = 10), rep(20, 2))) %>%
  select(-story, -sentence) %>%
  group_by(line) %>%
  summarise_if(is.numeric, mean) %>%
  pivot_longer(-line)
courtDragon %>%
streamgraph(key = "name",
value = "value",
date = "line",
height = "300px",
width = "750px",
scale = "continuous")In the Court of the Dragon
The Street of the Four Winds
No wonder this graphical representation is so hype. It simply looks amazingly good and transfer a bit of the emotions (and tension) at play in the two stories. In the Court of the Dragon is a real emotional rodeo and finishes in a true firework of fear and sadness. On the other hand, The Street of the Four Winds appear less intense. Just look at the scale, values are like three times lower.
Of course I cannot comment further here without spoiler. I think you will have to figure out the rest for yourselves. Go get the book!
What do I think
Looking back, I have to admit it is definitively much easier to work with the tidytext package. Although my coding skills certainly have improved a lot; no one can honestly consider four year old code (really?) without being slightly ashamed (I’ve been told that is called experience)–everything runs so much better now. You can easily extract any text as a table structuring it as token-per-row. It makes it tidy and allows you to pipe it into the tidyverse. It integrates perfectly with the gutenberg package too and that’s a real good news.
The tidyverse contains so many excellent visualization tools that give you the ability to express complex ideas and communicate with clarity, precision and efficiency. A good visualization also tells a story through the graphical depiction of statistical information. This way you can communicate a persuasive and compelling narrative. Yes, I believe visualization needs to tell a story to the audience. In this case, we’ve basically been doing the opposite trying to render the narrative of these stories in a simple visualization.
Although no visualization is ever going to be as good a narrative as a novel to me, I’m quite satisfied with the result here.